Auckland Town Hall
The IRIS measurement system was used to obtain and visualise 3D impulse responses in the Great Hall of the Auckland Town Hall, a traditional “shoe box” concert hall.
Background
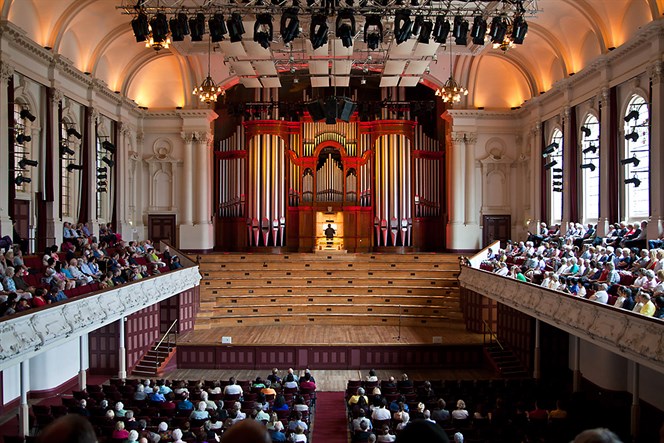
The Auckland Town Hall in New Zealand opened in 1911 and houses two performance spaces as well as administrative facilities for Auckland City. The Great Hall (Fig. 1) is a traditional “shoe box” concert hall modelled on the Neue Gewandhaus in Leipzig, Germany, and seats about 1500 people across three levels.

Fig. 1: The Great Hall of the Auckland Town Hall (Photograph by Hans Weichselbaum)
Application
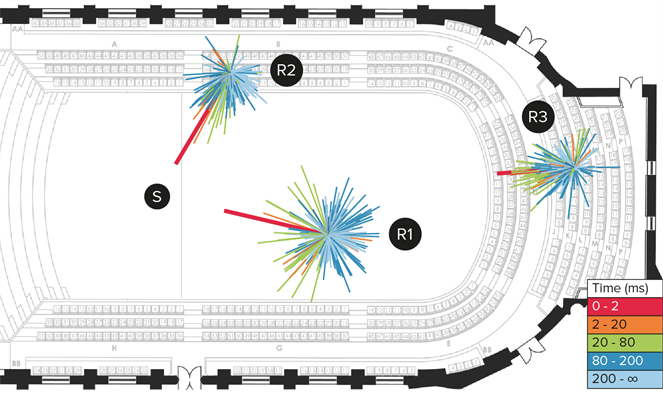
IRIS measurements were undertaken in a variety of positions in the Great Hall, and the results for one source position and three receiver positions are presented in this case study. The source, a dodecahedron loudspeaker, was placed at the centre of the stage, approximately 2 m back from the front and at a height of 1.5 m above the stage floor. The receiver positions, shown in Fig. 2, have the resulting IRIS plots overlaid. The microphone array was placed at listener head height, i.e. 1.2 m above the floor.
A 30 second sweep signal was used to excite the room. The resulting broadband IRIS plots in Fig. 2 show sound rays arriving at the receiver positions as vectors. The length of each vector indicates magnitude, the angle is the direction, and colour corresponds to the time of arrival (see key in Fig. 2). The direct sound vector is coloured red and assigned a magnitude of 0 dB. The subsequent vectors correspond to reflections greater than -40 dB.

Fig. 2: IRIS plots for three receiver positions in the Great Hall of Auckland Town Hall
Considering the IRIS plot at receiver position R1, in the stalls, the direct sound vector is the largest and points to the source. The subsequent orange vectors include floor reflections and very early reflections. The next interval of time, green, corresponds to the early arrival period. These vectors are relatively large in magnitude and arrive mostly from the sides, giving the impression of a wide and immersive sound. As time progresses (green to dark blue to light blue), the sound rays gradually become more uniformly distributed about the measurement position, indicating the sound field is becoming diffuse.
At position R2, in the balcony, the direct sound is quite prominent, followed by early energy (orange to green) in a similar direction to the direct sound. The sound field doesn’t become as diffuse as in position R1, indicated by the lack of sound rays behind the listener. This is consistent with having rear shielding and absorption from the raked padded seats located in this seating area, and the large area of curtains along the balcony walls. This position will sound very clear and perhaps more frontal than position R1.
Position R3, also in the balcony, is relatively far from the source and is overshadowed by the ceiling of the second balcony. As a result we see the direct sound is shorter than the other positions and similar to the reflection vectors. This indicates a smaller direct-to-reverberant ratio implying speech and percussive sounds may sound less clear. As with position R2, the steep raked seating absorbs a significant amount of energy behind the listener. Subjectively this may sound quieter and more frontal than the other positions.
These results are well in agreement with what is expected from the form and contents of the room, and the IRIS visualisation is an effective way of comparing the acoustical properties at different seating positions.
What people are saying
-
I regard the acoustic designs of Marshall Day Acoustics to be amongst the finest and probably the most innovative in the world.
Dr Anders Gade, Technical University of Denmark -
Marshall Day Software is like having an acoustic laboratory in the palm of your hand.
Associate Professor Yan Xiang, Tsinghua University -
The success of a musical performance depends on the sense of proximity of performer to listener. This sense is mediated largely by the directional properties of the reflected sound field.
Sir Harold Marshall